Pwndbg <-> WinDbg in the nutshell
This summer, I had the opportunity to participate in Google Summer of Code with the Pwndbg project - a popular GDB plugin used by PWN and RE lovers. Pwndbg provides a powerful context that enhance the debugging experience, containing a ton of useful tools and shortcuts (for example, vmmap, the command I use the most, is a significantly improved version of info proc mappings).
Although Pwndbg is mostly used by GDB users, there have been efforts to port this amazing plugin to other debuggers. Last year, Pwndbg has been ported to LLDB in a successful GSoC project. And this year, it will be ported to DbgEng.
So what is DbgEng? It’s the name of the internal debugger engine that powers the most popular Windows debuggers: WinDbg, cdb, ntsd, … In Windows/NT world, WinDbg/DbgEng is widely used for reverse engineer and exploit development for two primary reasons: 1) It’s specialized for Windows and 2) Windows Kernel debugging. (I might be wrong, x64dbg might be more friendly in some cases, especially in user mode debugging).
The main goal of this GSoC project was to port Pwndbg as a DbgEng extension. This would bring Pwndbg enhancements to the WinDbg console, providing a similar experience to using it with GDB or LLDB; and end users should be able to access all native WinDbg features while also using Pwndbg commands and context windows.
The challenges
Honestly, from the beginning of the summer and even now as I write this, I have severely underestimated how difficult this project would be. Around April, I spent a week looking at the DbgEng and WinDbg documentation and estimated that, given the sheer amount of it, the project would go smoothly and be finished by the end of July. However, there were two issues I didn’t take into account:
-
The documentation was entirely for C/C++, but our plugin runs in Python! While
DbgEngprovides a lot of functionality out-of-the-box, its semantics are vastly different fromGDBandLLDB. Objects inDbgEngare managed by COM interfaces using a component-model paradigm, while in GDB/LLDB they follow an object-oriented design. Although the latter part of this write-up shows a surprisingly easy solution, this issue was a major obstacle throughout the project. -
My health. This cost me a majority of the time that I should have spent on the project.
The Old Way of Context Management
DbgEng has seven major interfaces that were heavily involved in the initial implementation of the port:
IDebugClient: Interacts with the clientIDebugControl: Controls the debugging sessionIDebugSystemObjects: Manages threads and processesIDebugRegisters: Manages registersIDebugAdvanced: Provides access to internal APIsIDebugSymbols: Manages symbolsIDebugDataSpaces: Manages the address space and virtual memory
Since these don’t use an object-oriented approach, context management was a huge problem initially. In the DbgEng world, each process consists of a PID, engine PID, and HANDLE. In my initial implementation, processes were distinguished by their PID, and each time a process needed to perform an action, SetCurrentProcessId had to be used. The initial implementation for this approach can be found in this commit.
Type management
The hardest part of working with the Pwndbg API was the symbol and type system. In DbgEng, types are managed by TypeIds, which can be looked up with IDebugSymbols::GetTypeId. However, upon inspecting this function in IDA, I discovered it has a lot of limitations.
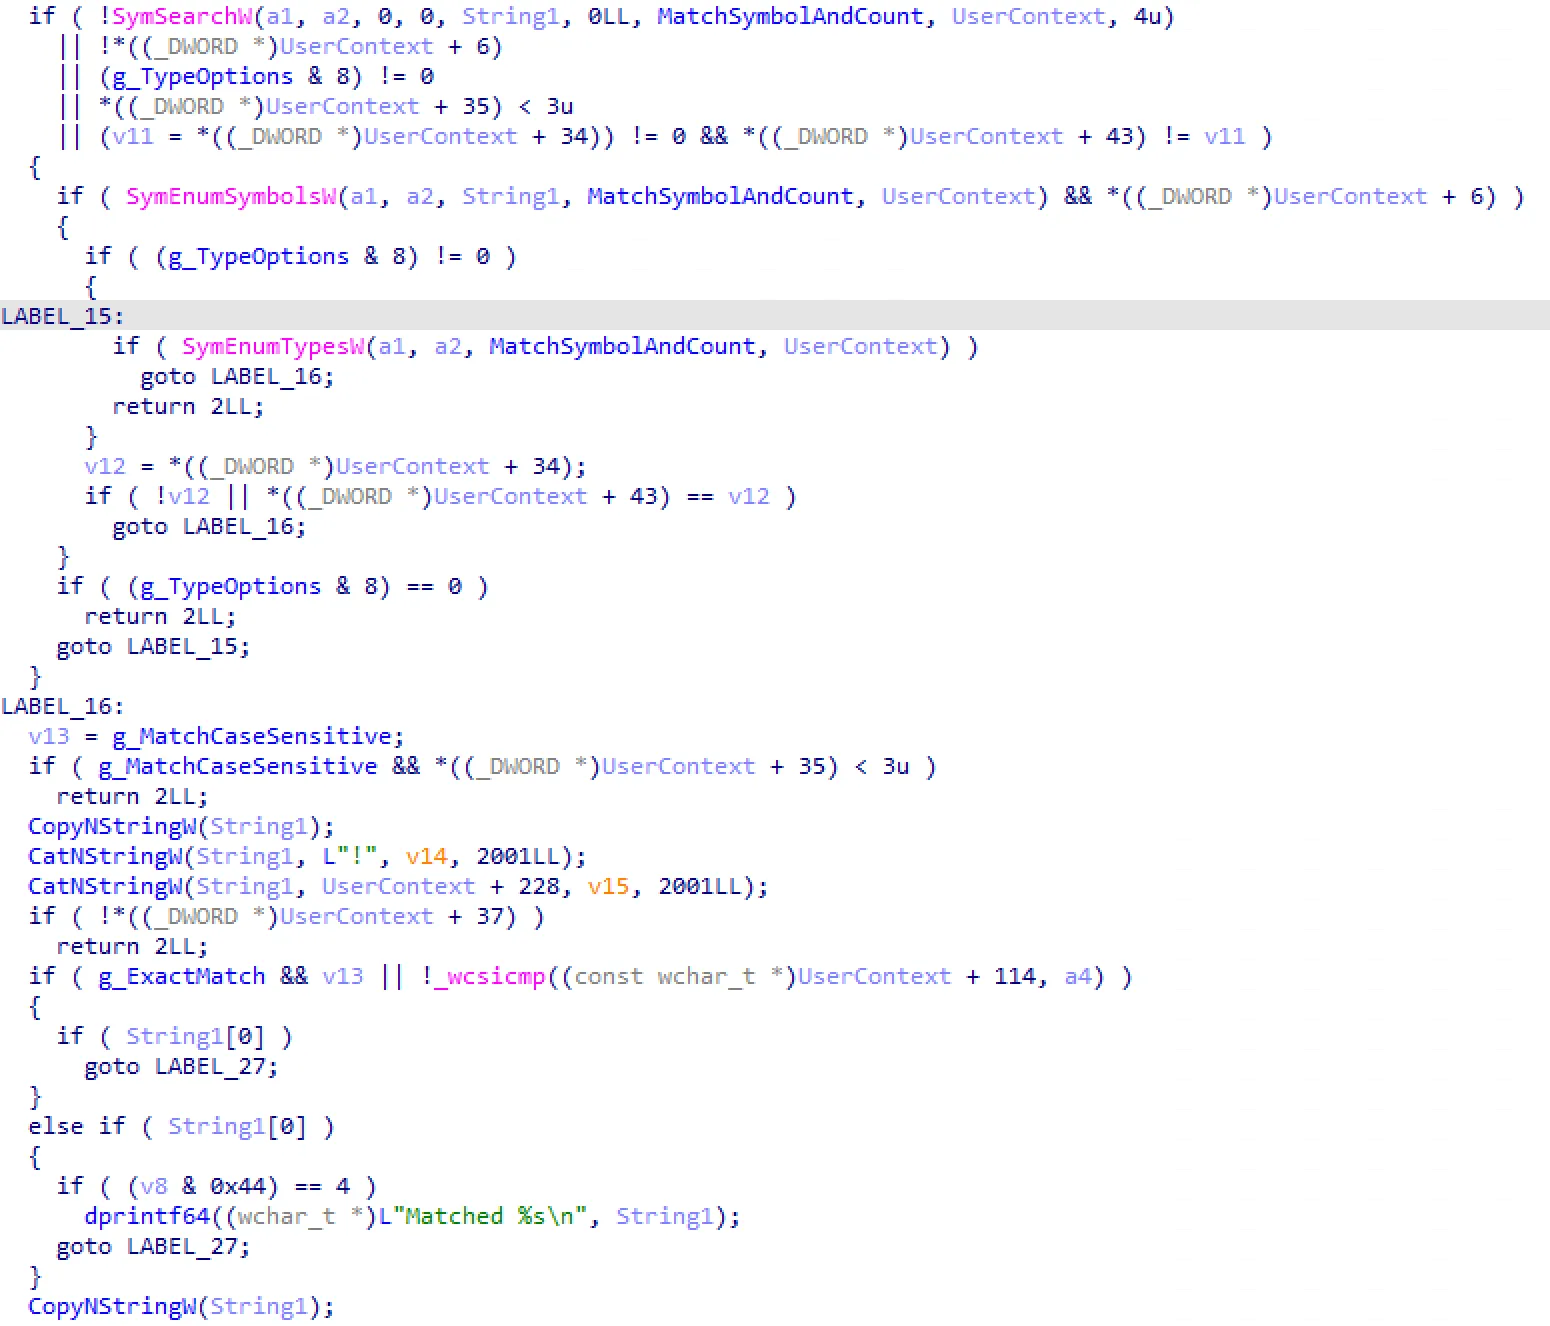 The function uses
 SymSearchW, SymEnumSymbolsW, and SymEnumTypesW to enumerate symbols in the target’s PDB file and then compares the found symbols literally with the search string.
This means that this function (which is called by GetTypeId) can only look up symbols directly from the PDB, not their derived types. During my tests, it managed to find the TypeId for void, but it couldn’t do the same for void*. Moreover, it couldn’t even find the TypeId for basic primitives like unsigned or unsigned long long.
After reverse engineering DbgEng, I found an obscure Request IOCTL that is exposed to manually control DbgEng’s internal data. This IOCTL is documented on Microsoft’s site, but it’s very hard to find on Google without searching for the exact term (probably because no one has ever used it before). This approach was implemented in this commit.
This IOCTL seemed very promising, but after testing it for a week, I found another huge limitation: the binding of data and type. The _DEBUG_TYPED_DATA struct is provided to represent typed data, and for given a TypeId, you can create typed data using EXT_TDOP_SET_FROM_TYPE_ID_AND_U64. And… it just didn’t work. Upon reverse engineering, I found that this IOCTL requires a valid base address for the underlying data, which makes it impossible to create values on the fly.
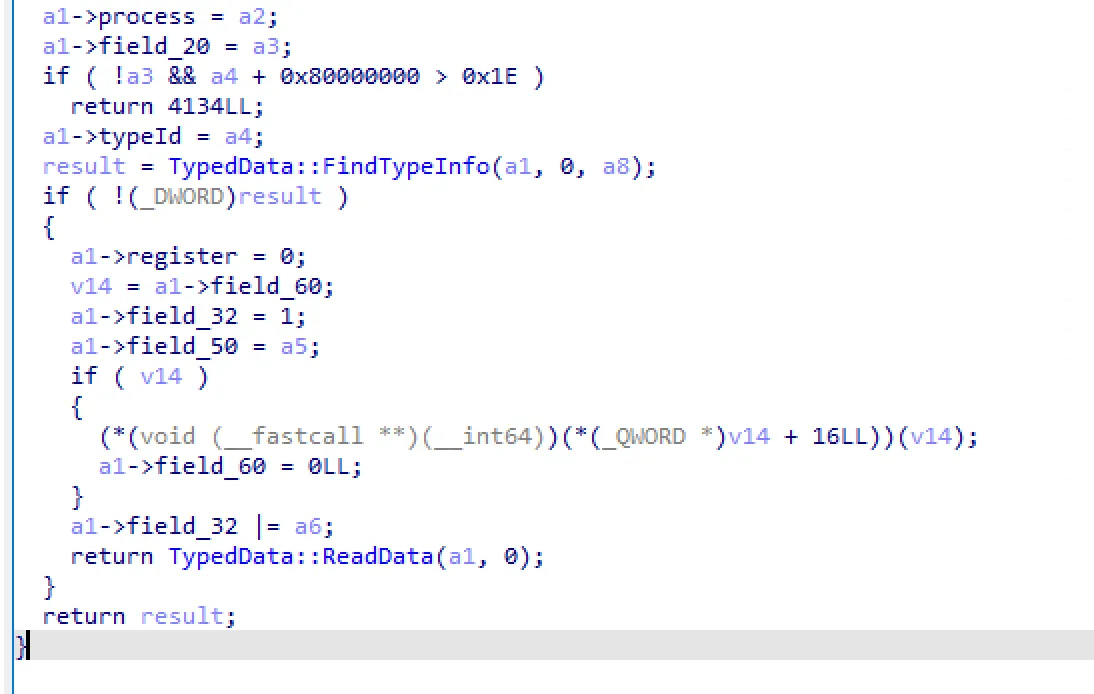 Pseudocode for
 dbgeng!TypedData::SetToTypedOffset. After parsing the given typeId, the function attempts to read the data from memory with TypedData::ReadData.
Interaction between C/C++ and Python
Before GSoC started, I wrote a quick and simple proof-of-concept Python REPL plugin for WinDbg. It used pybind11 to provide a Python runtime for C++. I intended to use comtypes and pybag to call COM APIs directly in Python. During implementation, I ran into a big problem with the DbgEng API: some functions (e.g., IDebugClient::Output) use variadic arguments, which are obviously not supported by comtypes (or COM itself!).
ctypes gives you the ability to dynamically change argtypes, but during testing, I ran into a nasty bug that took me a whole morning to figure out. In the end, I found an internal workaround after reading every line of code in comtypes, which is implemented in this commit.
Event callbacks and Python GIL
DbgEng uses an event callback system that requires you to implement a COM class (IDebugEventCallback) and register it with IDebugClient::SetEventCallbacks. The registered callbacks are then called in a separate thread from the main Python thread. In Python, only one thread is allowed to execute Python code at a time due to the Global Interpreter Lock (GIL).
ctypes is designed with this in mind. The docs state that
The function will release the GIL during the call
which made it seem like a non-issue. However, during testing, the plugin crashed a lot! At that time, I switched from my in-house PoC plugin to pykd-ext, another great Python REPL implementation, and I had to edit many parts of its codebase to handle the GIL issue. The ctypes library itself also has some GIL issues; I have debugged and found the root cause but haven’t had time to file the issue yet (stay tuned). The workarounds and the implementation of the event system can be found in this commit.
Latest design
The new way to manage contexts
I started function tracing in DbgEng to understand how the dx command works. And it turns out the calls aren’t handled in DbgEng itself, but in another library named DbgModel.
DbgModel provides an extensive, scriptable C++ data model. I actually found this library back in April but thought it was just for high-level scripting and that low-level access from the IDebug* interfaces would be better. When I recently looked into this library again, I found the solution to many of the issues I was facing.
0:000> dx Debugger.Sessions[0].Processes[0x581c].Threads[0x5b60].Stack.Frames[0]
Debugger.Sessions[0].Processes[0x581c].Threads[0x5b60].Stack.Frames[0] : ntdll!LdrpDoDebuggerBreak + 0x37
    LocalVariables   : Unexpected failure to dereference object
    Parameters       : Unexpected failure to dereference object
    Attributes
In the current design, contexts are managed by an object-oriented interface named IDebugHostContext. This interface provides a universal standpoint for all tools (evaluations, symbol lookups). The processes, threads, and stack frames are represented by a generic IDebugModel. For instance, the process internal attributes are represented as follows:
0:000> dx @$curprocess
@$curprocess     : test.exe
    Name             : test.exe
    Id               : 0x581c
    Handle           : 0x1f0
    Threads
    Modules
    Environment
    Devices
    Io
An effective way to manage types
Types are managed using the IDebugHostType interface. DbgModel categorizes objects into multiple groups, and the following groups are used in the implementation:
- Intrinsic values
- Native objects
Currently, casting objects from type to type only works with intrinsic values.
The COM wrappers
I implemented the wrappers for all COM interfaces used in the core implementation. This wrapper could be removed entirely after we can nicely parse the C headers DbgEng.h and DbgModel.h to C that preserve the _In_ and _Out_ attributes. comtypes is able to handle those quite nicely. pydbgeng provides a nice Perl script as a starting point.
The C/C++ Plugin
As of this writing, the plugin part hasn’t been implemented yet. The commands are dispatched manually using pykd’s REPL.
I intend to have a simple plugin that allows users to just type !vmmap or !context to show the virtual memory and context, respectively. However, DbgEng does not allow dynamic command registration; all commands must be DLL-exported C callbacks. So the current idea is to use macros, combined with a dispatching system implemented in Python, to effectively handle user commands.
Pull Requests
https://github.com/pwndbg/pwndbg/pull/3280
https://github.com/pwndbg/pwndbg/pull/3159
PoC
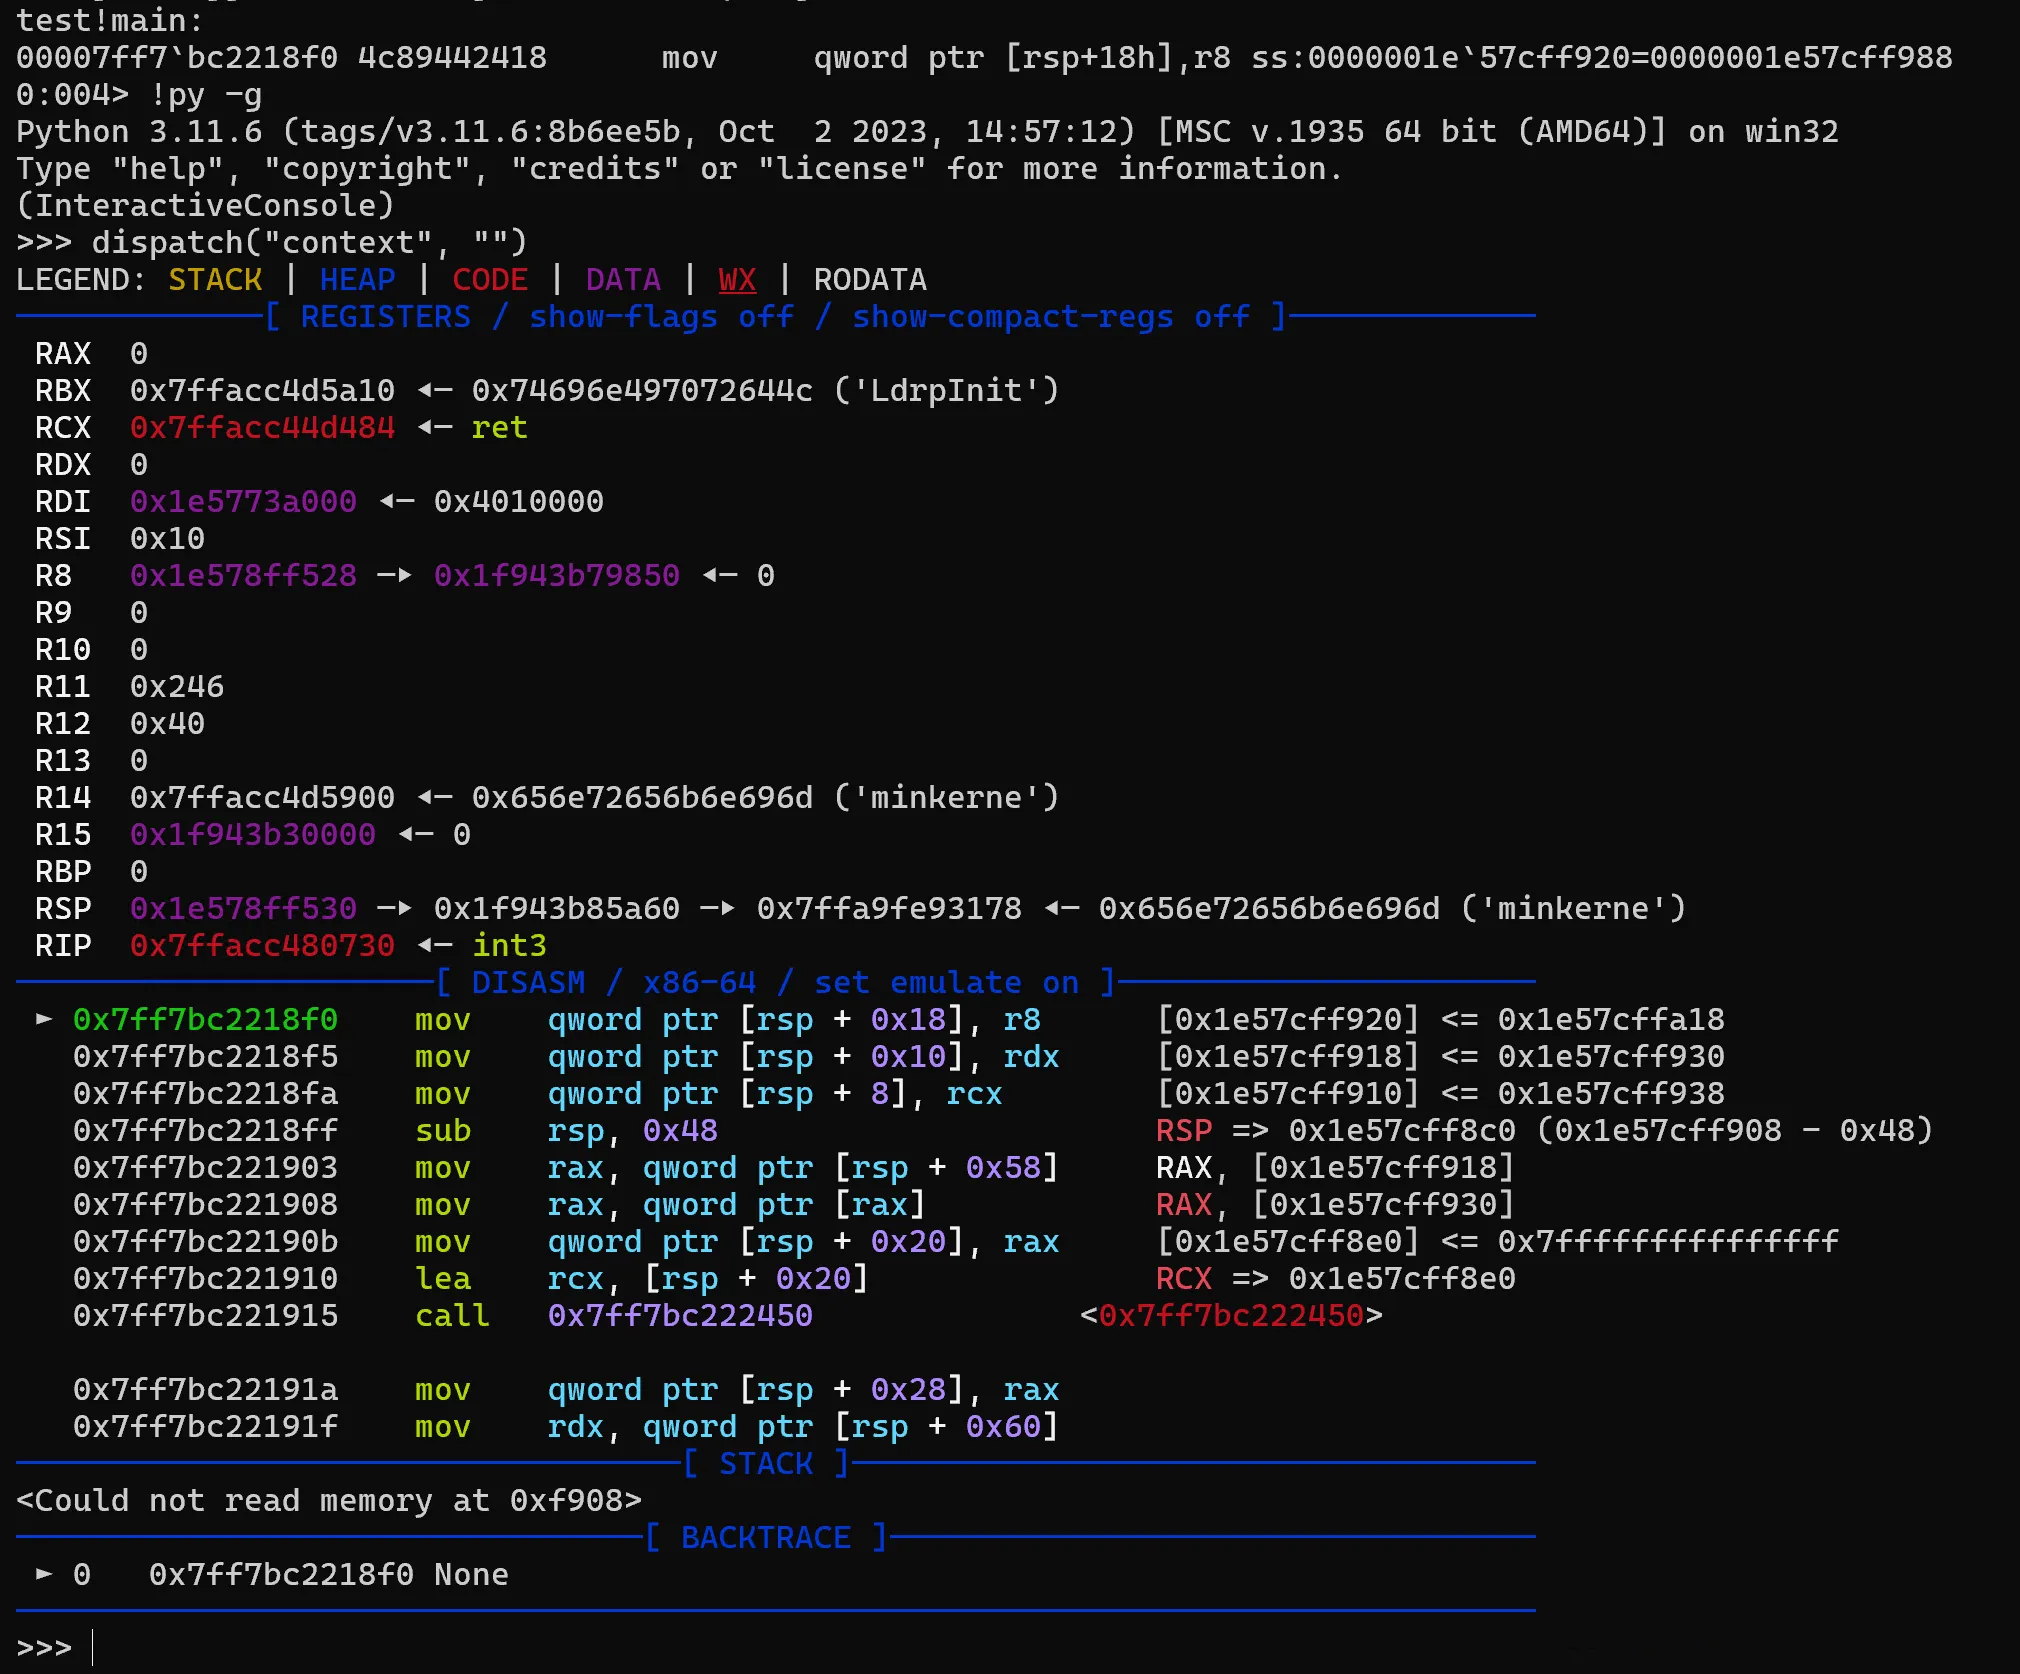
Currently, only the context command is tested.
Remarks
Even with the new debugger data model approach, a major problem is still there: there are literally no examples for its API. This meant every function had to be tested using a trial-and-error approach, and if something didn’t work, reverse engineering and debugging was the only way to know why.
At its current state, most of the core functionality is implemented. The current list of missing features is:
- Stack frames
- Proper type casting
- An improved event handling system
- The C++ plugin (and its build system)
- A proper build system to generate the TLB from MIDL files
- Unit tests